Map of the World 2024 – World Map 2025
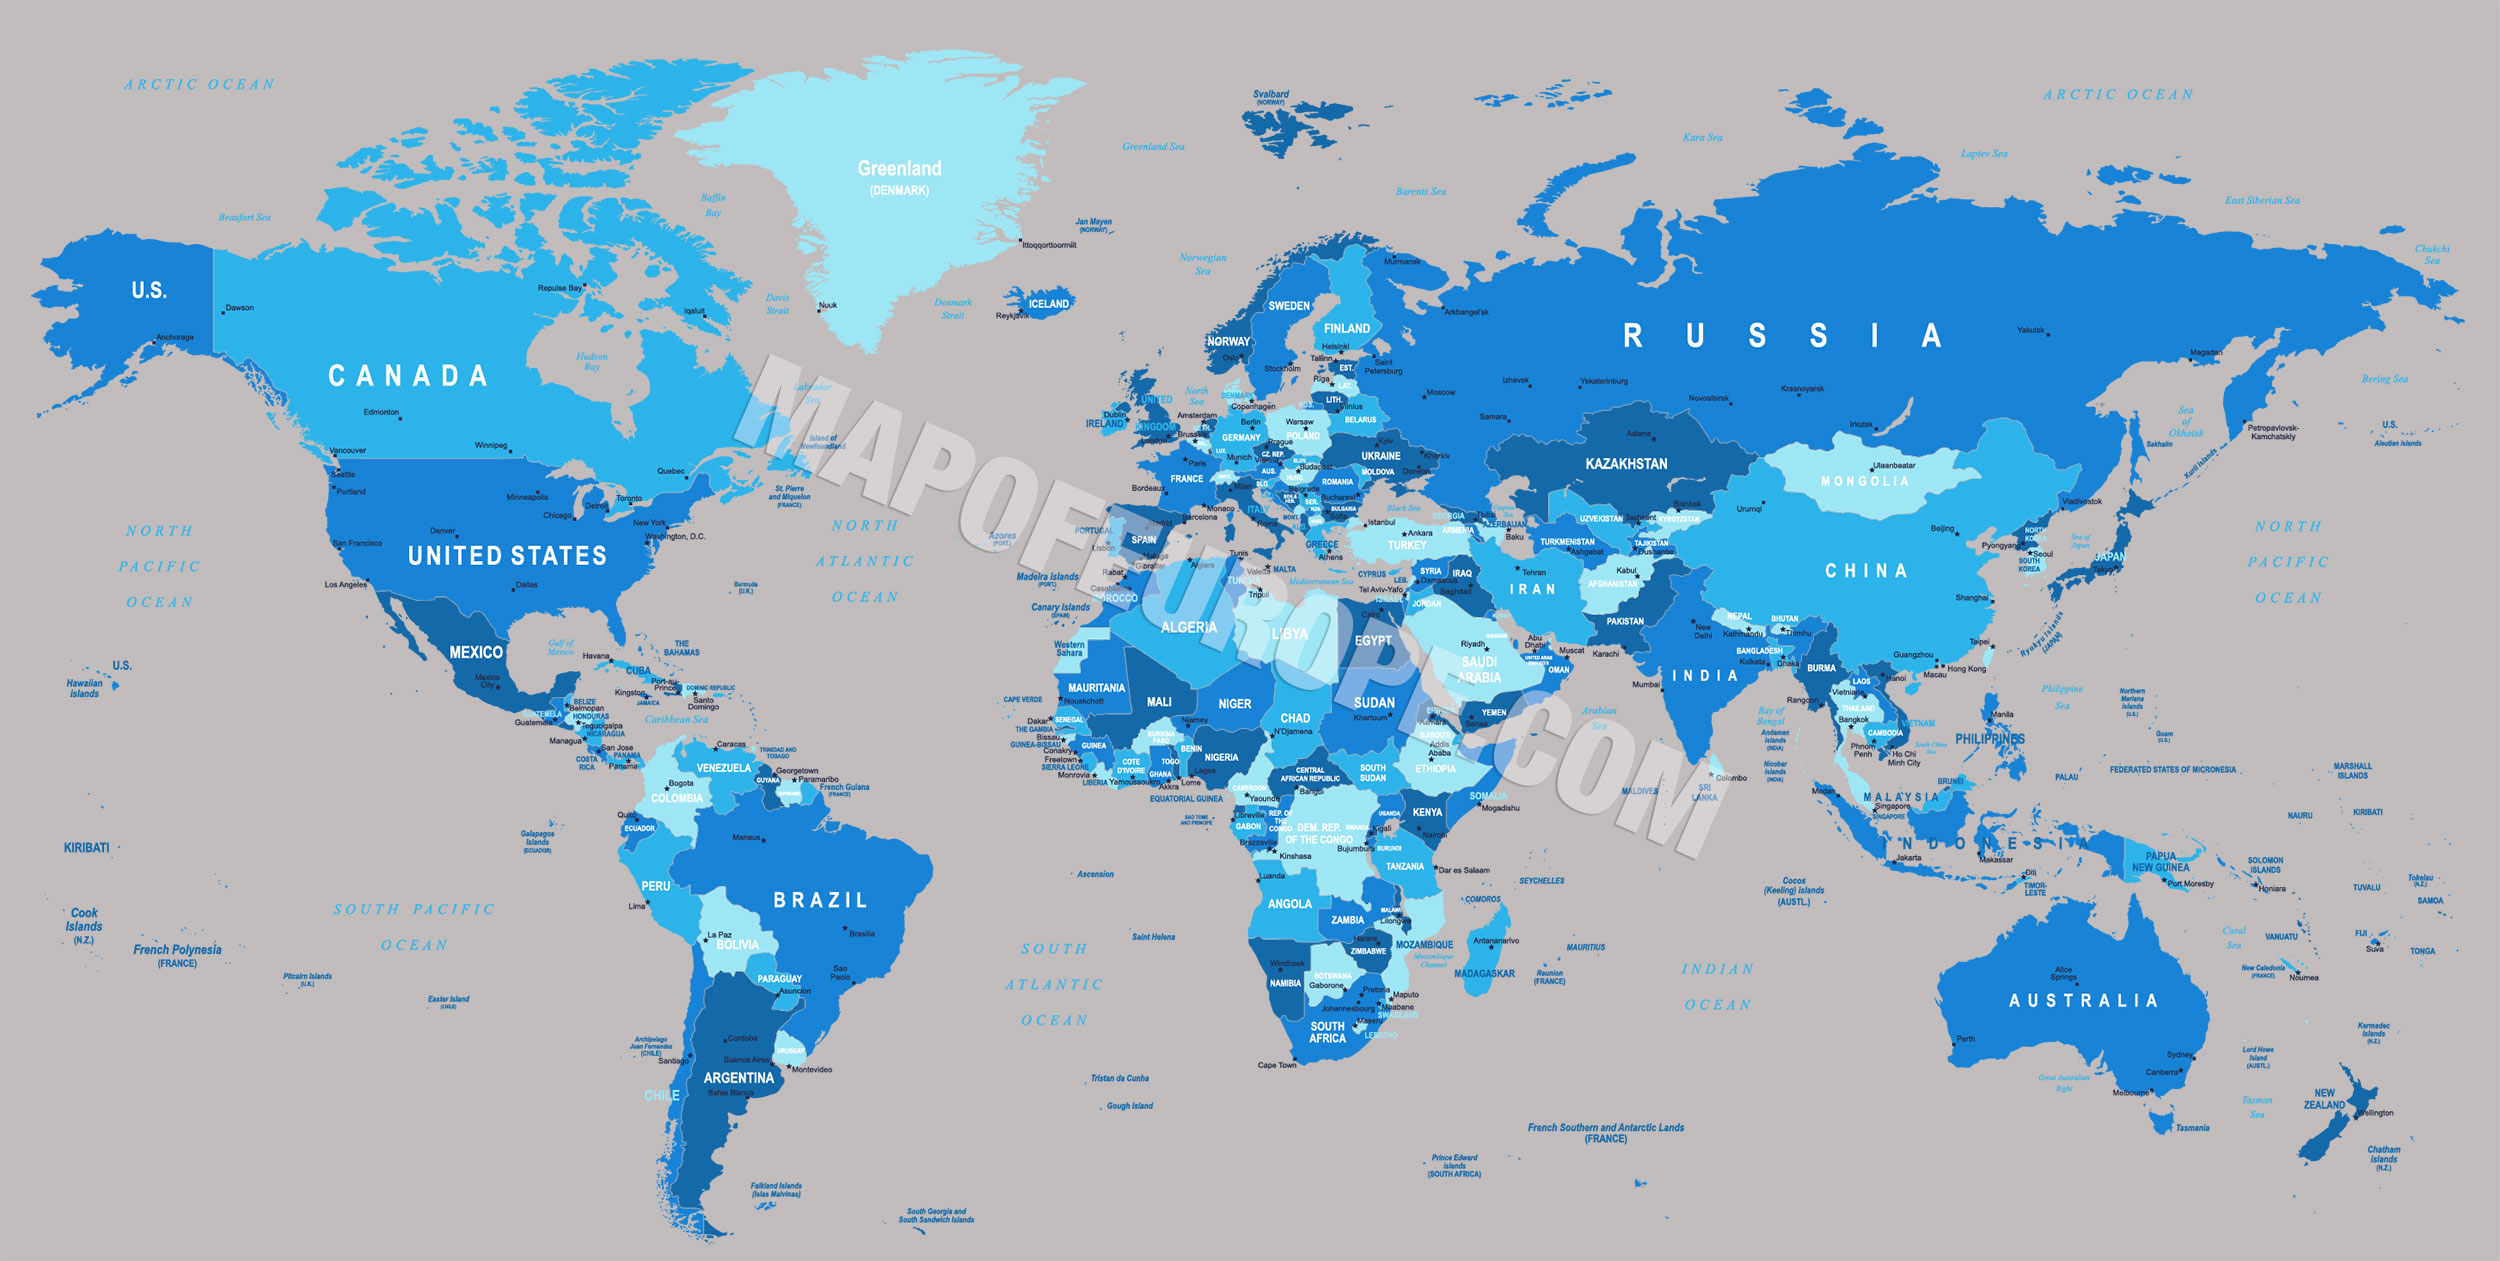
Above we have a new world map for 2025. The United States Department of State recognizes 195 independent countries but not all are shown on this map because some are to small for the scale of the map.
This is not a terrain relief map it is a political map of the world. So it does not show all the different topography that some of our other maps shop. This world map was designed a quick and easy reference to all the major countries in the world. It also references all the populated continents including Europe, Asia, North America, South America and Australasia (Australia).
As a political map it shows all the current boundaries for the countries represented and shows comparative size of the countries in question. Some distortion may occur as the earth is a sphere and this map of the world is a flat representation. Most distortion will occur around the equator as that is where the earth bulges due to its rotation.
World Map: Understanding Our Planet Through Visuals
World maps have long been a crucial tool for exploring, learning, and understanding our planet. From classrooms to boardrooms, world maps help us visualize distances, national borders, and physical geography. In this article, we’ll dive deep into the types of world maps, their historical evolution, and why they’re still important today. Embedded throughout are visuals that bring this information to life, offering a rich, interactive experience.
The Importance of World Maps Today
World maps continue to serve as essential tools in the modern age. Whether for educational purposes, travel planning, or global awareness, they provide a comprehensive view of the earth’s geographical layout. As global communication and travel have become more accessible, understanding where countries, oceans, and continents are located has never been more critical.
Today, world maps also play a role in logistics, environmental science, and even politics. They help in visualizing trade routes, tracking climate changes, and defining territorial disputes. Embedded in this article are various world maps that illustrate these points, showcasing the range of modern map applications.
Types of World Maps
Different types of world maps serve different purposes. Each offers unique insights depending on the focus of the viewer, whether they are interested in political borders, geographical features, or specific themes.
Political World Maps
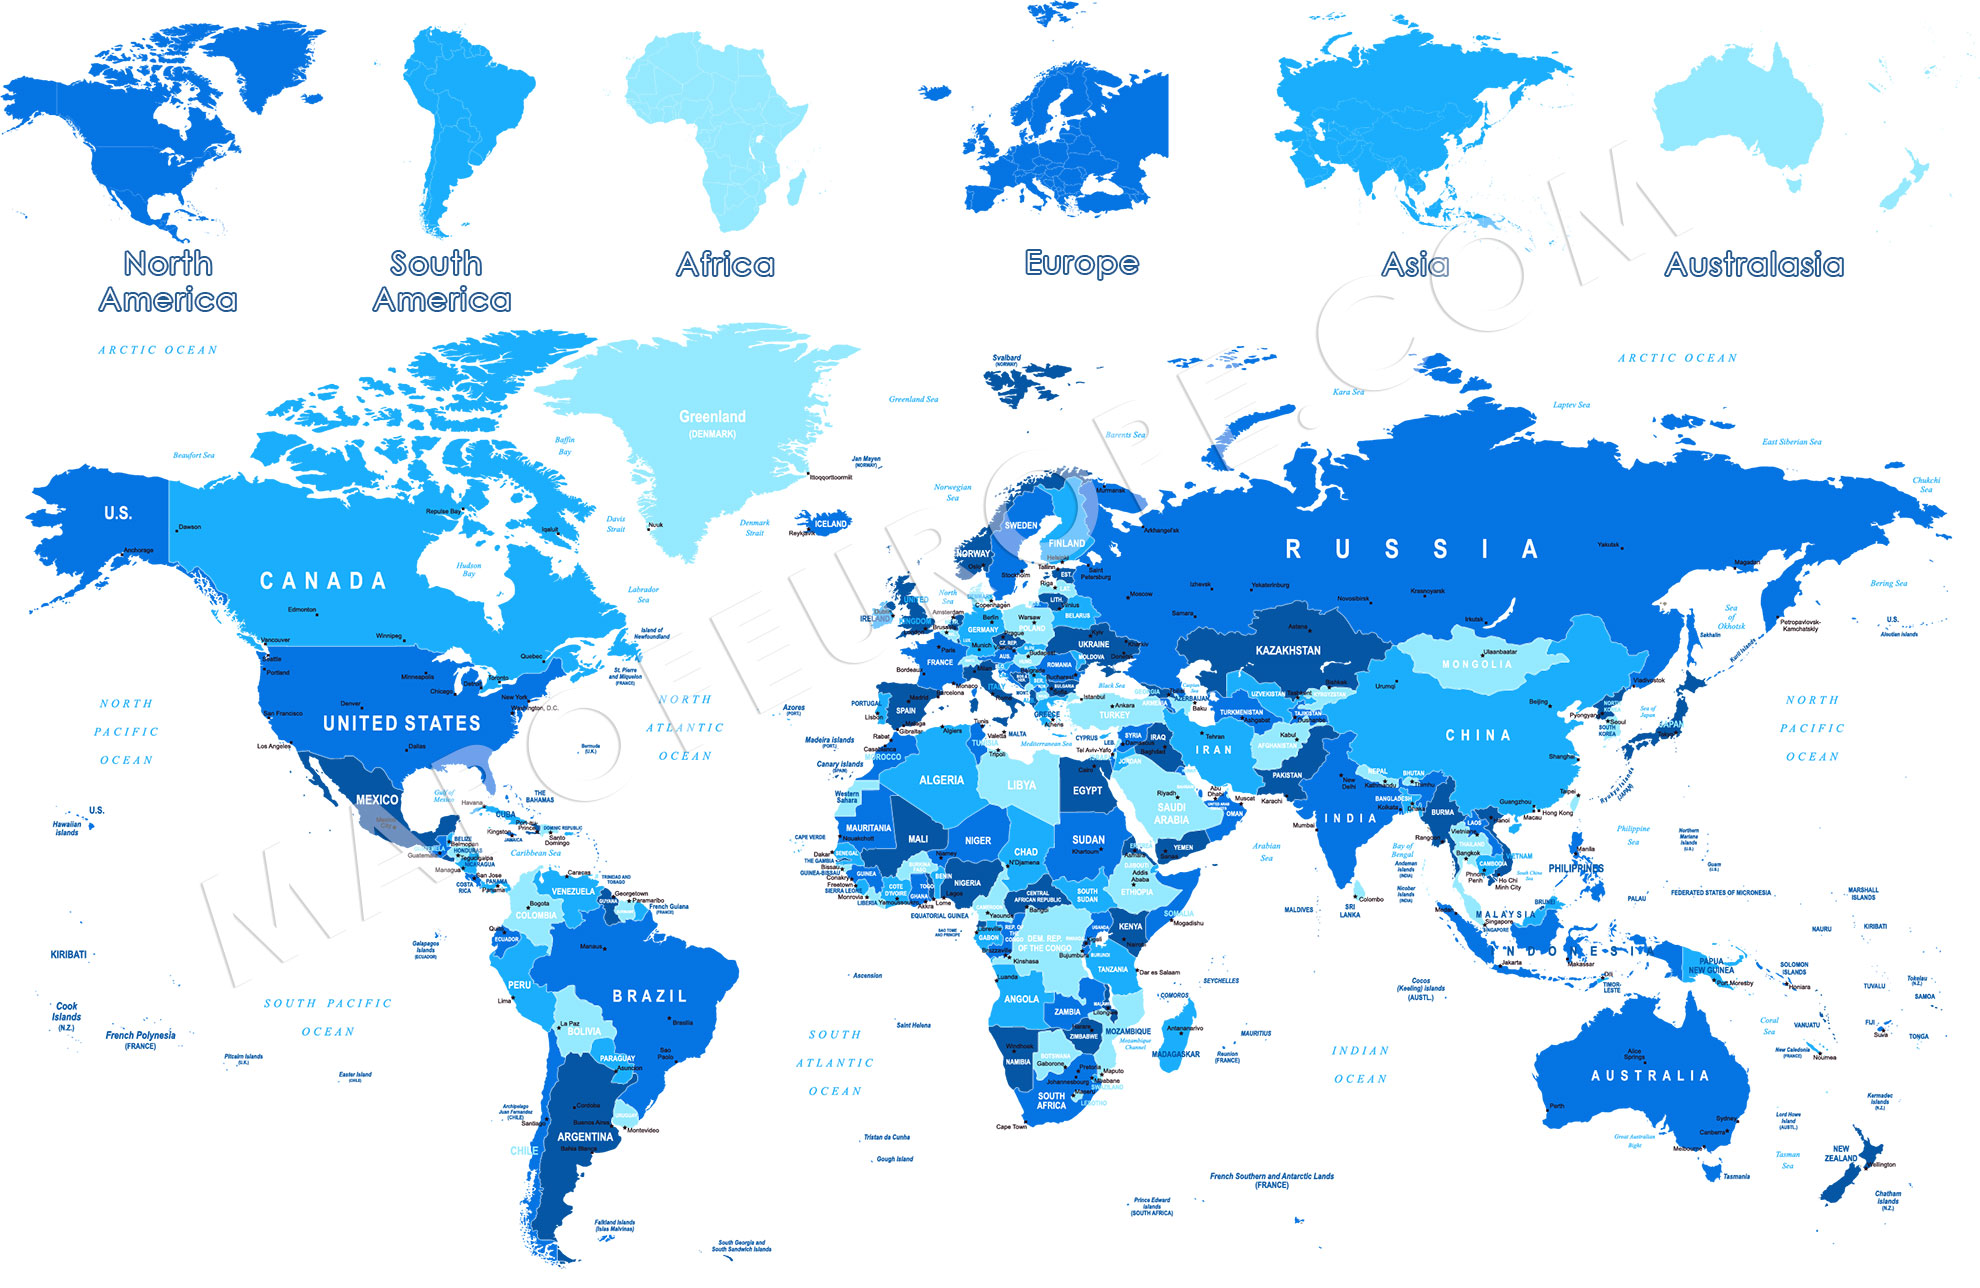
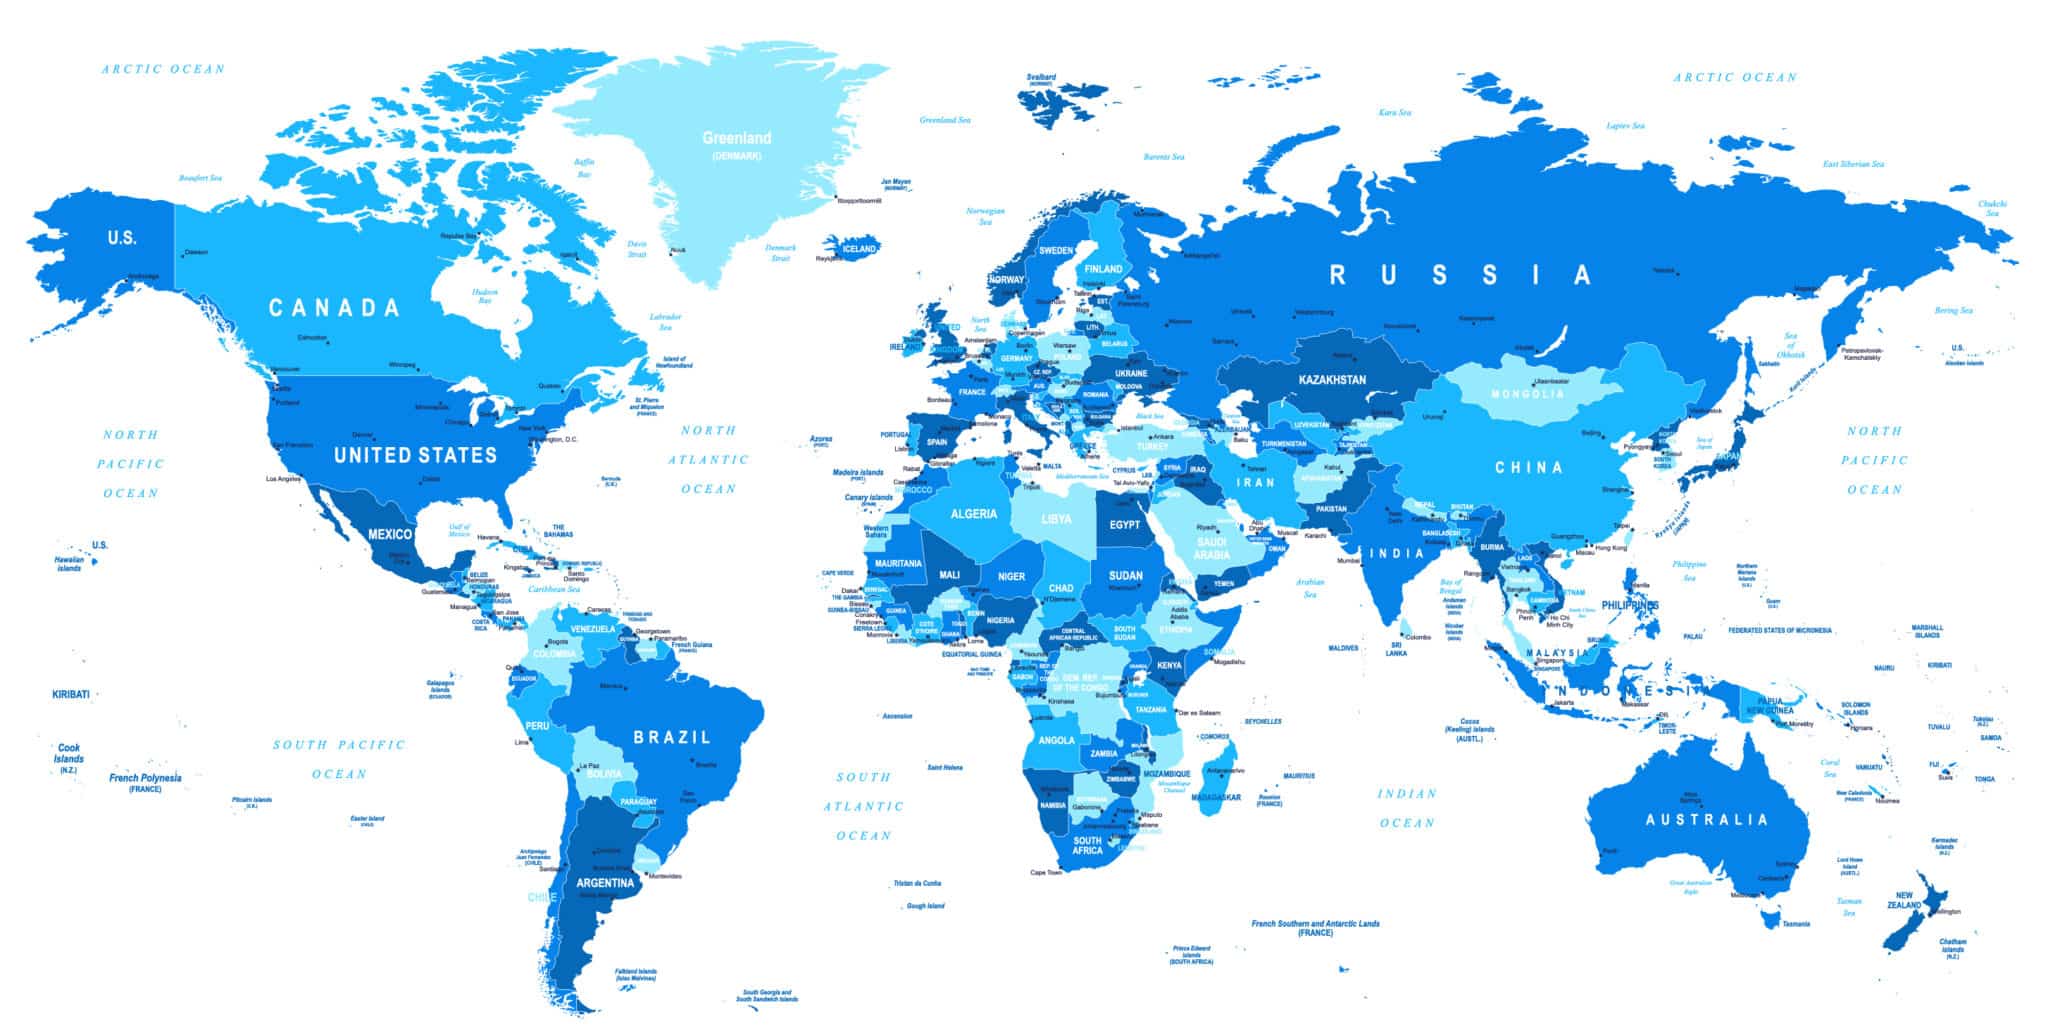
Political world maps are among the most widely used. They display national boundaries, capital cities, and important political subdivisions. These maps help users grasp the layout of countries, making them a staple in schools and offices alike. The embedded political map highlights country borders with vibrant colors, making it easier to distinguish between nations.
Physical World Maps
Physical world maps showcase the natural landscape of the Earth, highlighting features like mountains, rivers, lakes, and deserts. These maps provide valuable insights into the Earth’s topography, which is especially useful for understanding geological formations and climate zones. Our embedded physical map illustrates these natural features in detail, offering a close-up look at the Earth’s diverse terrain.
Thematic Maps
Thematic maps focus on specific data points, such as population density, economic activity, or climate patterns. They are particularly useful for researchers and academics studying global trends. The embedded thematic map in this article presents global population density, showing which regions are most densely populated and how human settlement patterns vary around the world.
World Map with Countries
History of World Mapping
The history of world maps is as rich and complex as the earth itself. The earliest known world maps date back to ancient Babylonian times, where crude representations of the known world were etched into clay tablets. As civilizations advanced, so did their map-making abilities.
During the Age of Exploration in the 15th and 16th centuries, European explorers like Christopher Columbus and Vasco da Gama relied heavily on maps, though many were inaccurate or incomplete. It wasn’t until the development of more accurate mathematical calculations and surveying tools in the 18th and 19th centuries that maps began to resemble the world we know today.
With the advent of satellite technology in the 20th century, maps became even more precise. Today, digital mapping tools like Google Maps allow users to explore every inch of the planet with stunning accuracy. The embedded historical map below shows how maps evolved over time, marking key shifts in global cartography.
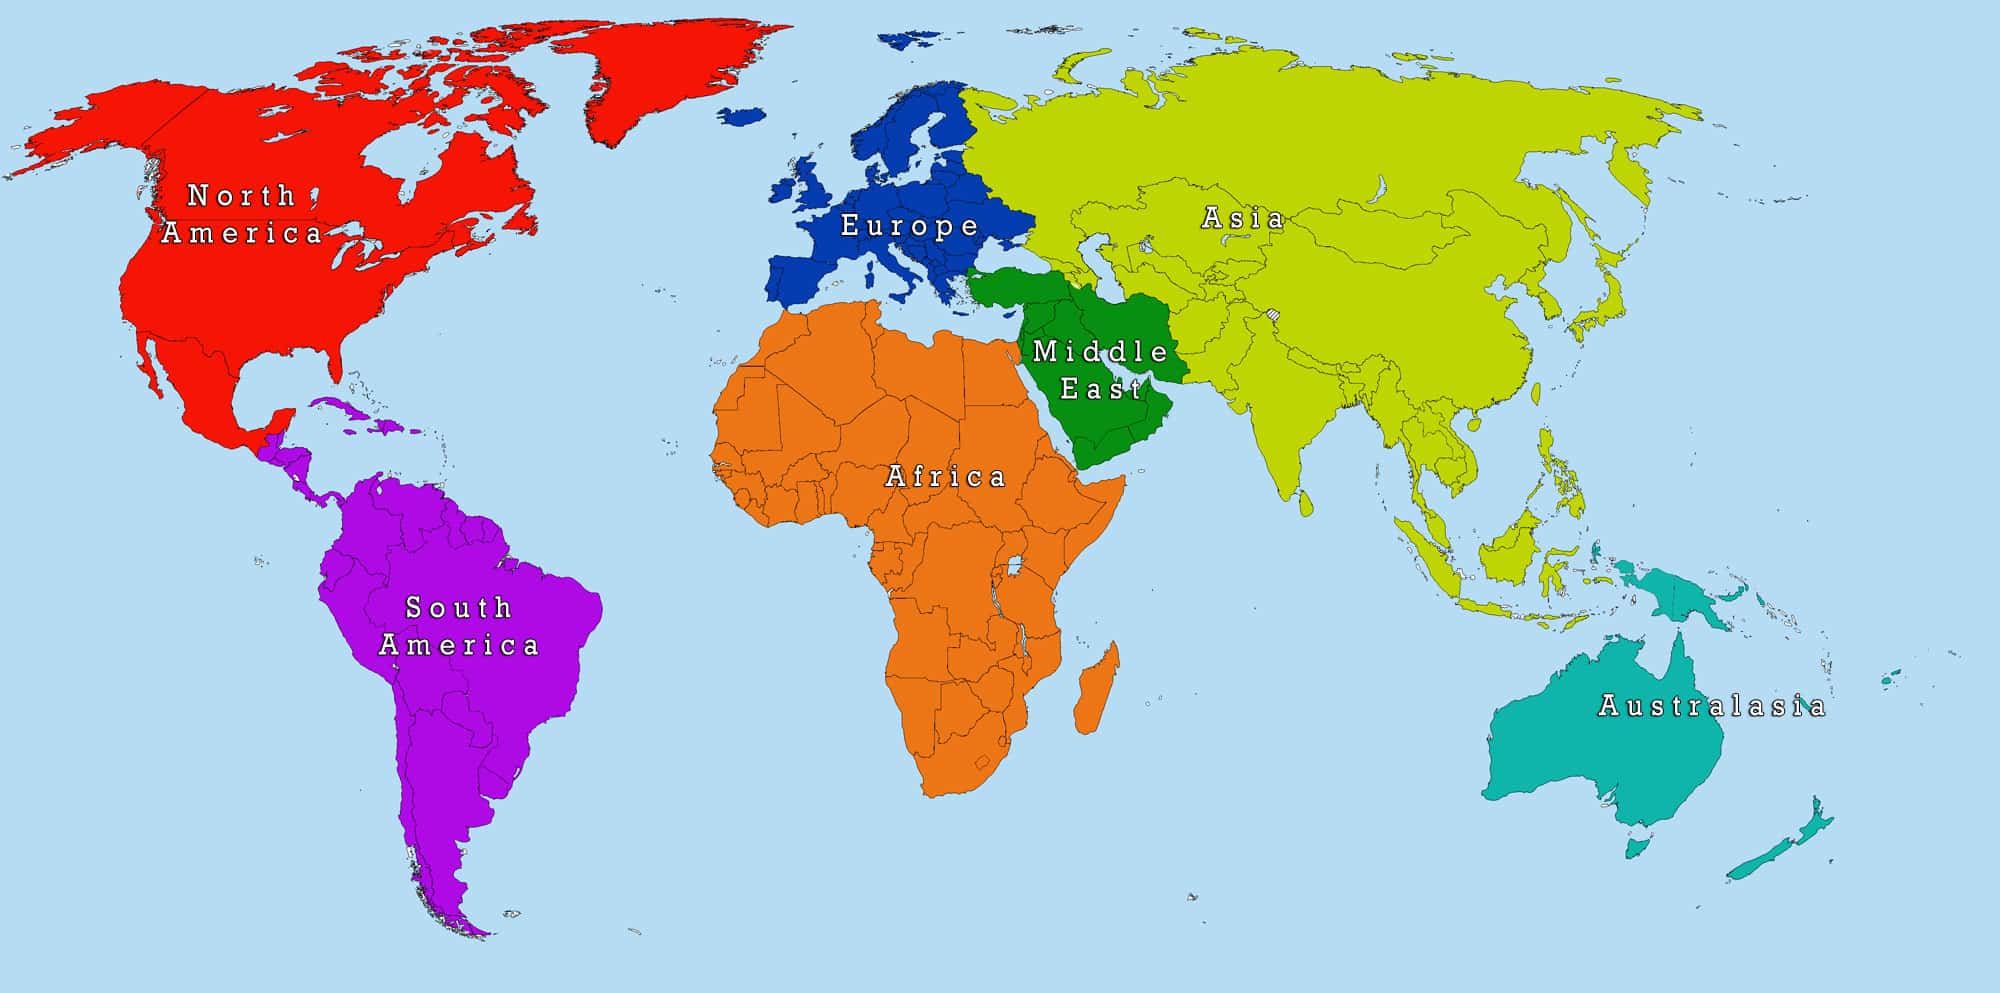
Below is a list continental border anomalies.
- Western Russia is marked as being part of Asia even though generally it is considered part of Europe. We did this because we felt there was room on the web for a simpler version of a world map, one that ignored some of the border ambiguities.
- We have added the Middle East as a region. This was due to many users emailing us and asking how does the middle east relate to the rest of the world.
- Australasia is marked in aqua and this region is sometimes referred to as Oceania. This is not strictly accurate but like we said above these matters are somewhat ambiguous. Strictly speaking the content is generally referred to as just Australia.
- Egypt is marked as Part of Africa above. While this is strictly correct it could have also fallen in under the region of the Middle East.
This map is not meant to be a definitive or even strictly accurate depiction of the world. As we said earlier that tends to be fluid anyway. This map is meant to be a quick reference guide for students and teachers to use when doing geography or cartography on the fly.
World Map Projections and Their Impact
World maps can often be misleading due to how the three-dimensional earth is projected onto a two-dimensional surface. Different projections distort various elements such as size, shape, or distance.
One of the most famous projections is the Mercator projection, often criticized for enlarging the size of landmasses near the poles while shrinking those near the equator. This makes countries like Greenland appear disproportionately large compared to equatorial nations like Africa.
Another popular projection is the Peters projection, which attempts to correct these size distortions by accurately representing land area. While it offers a more realistic view of country sizes, it sacrifices shape accuracy.
The Robinson projection, which you’ll find in many educational settings, strikes a balance between size and shape distortion. It’s a compromise map projection that offers a more visually appealing view of the world. The visuals in this article illustrate the differences between these projections, highlighting how each affects our perception of the Earth.
World Map for 2019.
Has much changed since we added World Map 2018 ? Not really. There are still wars raging in the middle east that threaten to change the face of the world map but borders have not been redrawn as yet.
There is still Putin’s Russia pressurising the Ukraine, which has potential to change the face of the world map and redraw some borders in Europe.
Africa is surprisingly stable for now and not much has changed on that continent.
China’s military is becoming more recalcitrant in the the South China Sea and some of the islands and atolls it has squatted on have the potential to change China’s borders but with an increasingly aggressive president in the USA, we might see some flash points in this area.
Interactive World Maps: A New Era
The world of cartography has evolved significantly with the advent of digital technology. Interactive world maps have revolutionized the way we engage with geography. From tracking real-time weather patterns to exploring global shipping routes, interactive maps allow users to zoom in, pan around, and experience the world in a way that static maps could never offer.
Websites like Google Maps and Mapbox provide users with endless options for exploring the globe in real time. Additionally, educational tools like GeoGuessr allow users to “travel” around the world by identifying locations based on street views. Interactive maps, such as the one embedded here, offer a glimpse into this new era of cartography, combining data with user interactivity to create a dynamic experience.
Here at Europe map we have a good interactive map of Europe and his is possibly the best and most easily read political map of Europe
Another good reference for world maps is this page on Wikipedia.
How to Choose the Right World Map
Choosing the right world map depends on your needs. Are you planning a trip? A political map that clearly outlines borders and capitals might be your best bet. If you’re a geography enthusiast or teacher, a physical map displaying mountain ranges, oceans, and rivers could be ideal.
For researchers or those interested in specific data sets, thematic maps that focus on climate, population density, or economic trends are the way to go. When deciding which map to use, consider the level of detail, purpose, and whether you need a physical or interactive version.
Our embedded maps throughout this article can help guide your decision by offering visual examples of each type. Whether for education, work, or personal curiosity, the right world map can make all the difference in understanding our planet.
Another thing that makes this map of the world stand out is that it includes all the little island archipelagos of the world. So if you are going to one of those remote holiday destinations like the Canary Islands. On this map you will be able to see where it relates to the rest of the world.
If you want to enlarge the map click on it and then click on the little “x” in the top right corner to get the biggest possible version of the map. You will have to scroll around it as it generally to large for most computer screens.
Why World Maps Still Matter
Despite the rise of digital tools and GPS, traditional world maps still hold an important place in our daily lives. They offer a comprehensive overview of our planet, helping us better understand the vastness and diversity of the world around us. World maps are not only educational but also a gateway to exploring new cultures and places.
With the rich history, diverse projections, and modern advancements in interactive maps, the way we view the world continues to evolve. Embedded within this article are visuals that enhance your journey, making it easier to grasp the geographic and political landscape of our planet.
One of the new countries it lists is South Sudan, which is probably Africa’s most recent country. other non European countries that are listed are New Zealand, Mexico, Thailand and North Korea.
Some European countries that are listed are France, Germany, Iceland, Croatia and Denmark.
Enjoy the free use of this map of the world and we hope to bring you guys more in the near future.
We kept the Old World Map below:
World Map with Continents
List of Countries in the World and the Capital Cities ordered by population
| Country | Capital | Population | Area (km²) |
|---|---|---|---|
| China | Beijing | 1,444,216,107 | 9,596,961 |
| India | New Delhi | 1,393,409,038 | 3,287,263 |
| United States | Washington, D.C. | 331,002,651 | 9,525,067 |
| Indonesia | Jakarta | 273,523,615 | 1,904,569 |
| Pakistan | Islamabad | 225,199,937 | 796,095 |
| Brazil | Brasília | 213,993,437 | 8,515,767 |
| Nigeria | Abuja | 211,400,708 | 923,768 |
| Bangladesh | Dhaka | 166,303,498 | 147,570 |
| Russia | Moscow | 145,912,025 | 17,098,242 |
| Mexico | Mexico City | 130,262,216 | 1,964,375 |
| Japan | Tokyo | 126,476,461 | 377,915 |
| Ethiopia | Addis Ababa | 114,963,588 | 1,104,300 |
| Philippines | Manila | 112,610,042 | 300,000 |
| Egypt | Cairo | 102,334,404 | 1,002,450 |
| Vietnam | Hanoi | 97,338,579 | 331,210 |
| Germany | Berlin | 83,783,942 | 357,022 |
| Turkey | Ankara | 84,339,067 | 783,356 |
| Iran | Tehran | 83,992,949 | 1,648,195 |
| Democratic Republic of the Congo | Kinshasa | 89,561,403 | 2,344,858 |
| Thailand | Bangkok | 69,799,978 | 513,120 |
| France | Paris | 65,273,511 | 551,695 |
| United Kingdom | London | 67,886,011 | 242,500 |
| Italy | Rome | 60,461,826 | 301,340 |
| South Africa | Pretoria (executive), Cape Town (legislative), Bloemfontein (judicial) | 59,308,690 | 1,219,090 |
| Tanzania | Dodoma | 59,734,218 | 947,303 |
| Myanmar | Naypyidaw | 54,409,800 | 676,578 |
| Kenya | Nairobi | 53,771,296 | 580,367 |
| South Korea | Seoul | 51,269,185 | 100,210 |
| Colombia | Bogotá | 50,882,891 | 1,141,748 |
| Spain | Madrid | 46,754,778 | 505,990 |
| Uganda | Kampala | 45,741,007 | 241,550 |
| Argentina | Buenos Aires | 45,376,763 | 2,780,400 |
| Ukraine | Kyiv | 44,209,733 | 603,550 |
| Algeria | Algiers | 43,851,044 | 2,381,741 |
| Sudan | Khartoum | 43,849,260 | 1,861,484 |
| Iraq | Baghdad | 40,222,493 | 438,317 |
| Afghanistan | Kabul | 38,928,346 | 652,230 |
| Poland | Warsaw | 37,846,611 | 312,696 |
| Canada | Ottawa | 37,742,154 | 9,984,670 |
| Morocco | Rabat | 36,910,560 | 446,550 |
| Saudi Arabia | Riyadh | 34,813,871 | 2,149,690 |
| Uzbekistan | Tashkent | 33,469,203 | 448,978 |
| Peru | Lima | 32,971,854 | 1,285,216 |
| Angola | Luanda | 32,866,272 | 1,246,700 |
| Malaysia | Kuala Lumpur | 32,776,194 | 330,803 |
| Mozambique | Maputo | 31,255,435 | 801,590 |
| Ghana | Accra | 31,072,940 | 238,533 |
| Yemen | Sana’a | 29,825,964 | 527,968 |
| Nepal | Kathmandu | 29,136,808 | 147,516 |
| Venezuela | Caracas | 28,435,940 | 916,445 |
| Madagascar | Antananarivo | 27,691,018 | 587,041 |
| Cameroon | Yaoundé | 26,545,863 | 475,442 |
| Côte d’Ivoire | Yamoussoukro (official), Abidjan (economic) | 26,378,274 | 322,463 |
| North Korea | Pyongyang | 25,778,816 | 120,538 |
| Australia | Canberra | 25,203,198 | 7,692,024 |
| Niger | Niamey | 24,206,644 | 1,267,000 |
| Sri Lanka | Sri Jayawardenepura Kotte (official), Colombo (executive and commercial) | 21,413,249 | 65,610 |
| Burkina Faso | Ouagadougou | 20,903,273 | 274,200 |
| Mali | Bamako | 20,250,833 | 1,240,192 |
| Romania | Bucharest | 19,237,691 | 238,397 |
| Malawi | Lilongwe | 19,129,952 | 118,484 |
| Chile | Santiago | 19,116,201 | 756,096 |
| Kazakhstan | Nur-Sultan | 18,776,707 | 2,724,900 |
| Zambia | Lusaka | 18,383,955 | 752,618 |
| Guatemala | Guatemala City | 17,915,568 | 108,889 |
| Ecuador | Quito | 17,643,054 | 283,561 |
| Syria | Damascus | 17,500,658 | 185,180 |
| Netherlands | Amsterdam (official), The Hague (seat of government) | 17,134,872 | 41,543 |
| Senegal | Dakar | 16,743,927 | 196,722 |
| Chad | N’Djamena | 16,425,864 | 1,284,000 |
| Somalia | Mogadishu | 15,893,222 | 637,657 |
| Zimbabwe | Harare | 14,862,924 | 390,757 |
| Guinea | Conakry | 13,132,795 | 245,857 |
| Rwanda | Kigali | 12,952,218 | 26,338 |
| Benin | Porto-Novo (official), Cotonou (seat of government) | 12,123,200 | 114,763 |
| Burundi | Bujumbura | 11,890,784 | 27,834 |
| Tunisia | Tunis | 11,818,619 | 163,610 |
| Bolivia | Sucre (constitutional), La Paz (administrative) | 11,673,021 | 1,098,581 |
| Belgium | Brussels | 11,589,623 | 30,528 |
| Haiti | Port-au-Prince | 11,402,528 | 27,750 |
| Cuba | Havana | 11,326,616 | 109,884 |
| South Sudan | Juba | 11,193,725 | 644,329 |
| Dominican Republic | Santo Domingo | 10,847,910 | 48,671 |
| Czech Republic | Prague | 10,708,981 | 78,866 |
| Greece | Athens | 10,423,054 | 131,957 |
| Jordan | Amman | 10,203,134 | 89,342 |
| Portugal | Lisbon | 10,196,709 | 92,090 |
| Azerbaijan | Baku | 10,139,177 | 86,600 |
| Sweden | Stockholm | 10,099,265 | 450,295 |
| Hungary | Budapest | 9,660,351 | 93,028 |
| United Arab Emirates | Abu Dhabi | 9,890,400 | 83,600 |
| Belarus | Minsk | 9,449,323 | 207,600 |
| Honduras | Tegucigalpa | 9,904,607 | 112,492 |
| Israel | Jerusalem (internationally unrecognized) | 9,053,300 | 20,770 |
| Papua New Guinea | Port Moresby | 8,947,024 | 462,840 |
| Togo | Lomé | 8,278,724 | 56,785 |
| Serbia | Belgrade | 8,737,371 | 77,474 |
| Switzerland | Bern | 8,654,622 | 41,290 |
| Sierra Leone | Freetown | 8,153,936 | 71,740 |
| Hong Kong | Hong Kong | 7,474,600 | 1,104 |
| Laos | Vientiane | 7,275,560 | 236,800 |
| Paraguay | Asunción | 7,132,538 | 406,752 |
| Bulgaria | Sofia | 6,948,445 | 110,879 |
| Lebanon | Beirut | 6,825,445 | 10,452 |
| Libya | Tripoli | 6,871,292 | 1,759,540 |
| El Salvador | San Salvador | 6,486,201 | 21,041 |
| Nicaragua | Managua | 6,624,554 | 130,373 |
| Kyrgyzstan | Bishkek | 6,524,195 | 199,951 |
| Turkmenistan | Ashgabat | 6,031,200 | 488,100 |
| Singapore | Singapore | 5,896,686 | 728 |
| Denmark | Copenhagen | 5,792,202 | 42,916 |
| Finland | Helsinki | 5,540,720 | 338,424 |
| Slovakia | Bratislava | 5,459,642 | 49,035 |
| Norway | Oslo | 5,421,241 | 323,802 |
| Eritrea | Asmara | 3,546,421 | 117,600 |
| Costa Rica | San José | 5,094,118 | 51,100 |
| Central African Republic | Bangui | 4,829,767 | 622,984 |
| Ireland | Dublin | 4,937,786 | 70,273 |
| New Zealand | Wellington | 4,822,233 | 270,467 |
| Oman | Muscat | 4,974,986 | 309,500 |
| Country | Capital | Population (2021) | Area (km²) |
| Croatia | Zagreb | 4,105,267 | 56,594 |
| Kuwait | Kuwait City | 4,270,571 | 17,818 |
| Panama | Panama City | 4,314,767 | 75,420 |
| Georgia | Tbilisi | 3,989,167 | 69,700 |
| Mongolia | Ulaanbaatar | 3,329,289 | 1,564,116 |
| Armenia | Yerevan | 2,963,243 | 29,743 |
| Lithuania | Vilnius | 2,722,289 | 65,300 |
| Jamaica | Kingston | 2,961,167 | 10,991 |
| Qatar | Doha | 2,881,053 | 11,586 |
| Namibia | Windhoek | 2,540,905 | 825,615 |
| Lesotho | Maseru | 2,142,249 | 30,355 |
| Slovenia | Ljubljana | 2,078,654 | 20,273 |
| Latvia | Riga | 1,886,198 | 64,589 |
| Botswana | Gaborone | 2,351,627 | 581,730 |
| Gambia | Banjul | 2,416,668 | 10,689 |
| Guinea-Bissau | Bissau | 1,968,001 | 36,125 |
| Gabon | Libreville | 2,225,734 | 267,668 |
| Mauritania | Nouakchott | 4,649,658 | 1,030,700 |
| Trinidad and Tobago | Port of Spain | 1,399,488 | 5,131 |
| Estonia | Tallinn | 1,326,535 | 45,227 |
| Eswatini | Mbabane (administrative), Lobamba (legislative, royal) | 1,160,164 | 17,364 |
| Timor-Leste | Dili | 1,318,445 | 14,919 |
| Cyprus | Nicosia | 1,207,359 | 9,251 |
| Djibouti | Djibouti | 988,000 | 23,200 |
| Fiji | Suva | 896,445 | 18,272 |
| Guyana | Georgetown | 786,508 | 214,969 |
| Bhutan | Thimphu | 771,608 | 38,394 |
| Comoros | Moroni | 869,601 | 1,861 |
| Solomon Islands | Honiara | 686,884 | 28,896 |
| Macao | Macao | 649,335 | 32 |
| Montenegro | Podgorica | 628,066 | 13,812 |
| Luxembourg | Luxembourg City | 634,814 | 2,586 |
| Western Sahara | Laayoune | 597,339 | 266,000 |
| Suriname | Paramaribo | 586,632 | 163,820 |
| Cape Verde | Praia | 555,987 | 4,033 |
| Malta | Valletta | 441,543 | 316 |
| Brunei | Bandar Seri Begawan | 437,479 | 5,765 |
| Bahamas | Nassau | 393,244 | 13,878 |
| Belize | Belmopan | 397,628 | 22,966 |
| Maldives | Malé | 540,544 | 298 |
| Iceland | Reykjavík | 366,130 | 103,000 |
| Vanuatu | Port Vila | 307,145 | 12,189 |
| Barbados | Bridgetown | 287,375 | 430 |
| São Tomé and Príncipe | São Tomé | 219,159 | 964 |
| Samoa | Apia | 198,414 | 2,842 |
| Saint Lucia | Castries | 183,627 | 617 |
| Kiribati | South Tarawa | 119,449 | 811 |
| Grenada | St. George’s | 112,523 | 344 |
| Saint Vincent and the Grenadines | Kingstown | 110,940 | 389 |
| Tonga | Nuku’alofa | 105,695 | 747 |
| Micronesia | Palikir | 115,023 | 702 |
| Seychelles | Victoria | 98,347 | 455 |
| Antigua and Barbuda | St. John’s | 97,929 | 442 |
| Andorra | Andorra la Vella | 77,265 | 468 |
| Dominica | Roseau | 71,986 | 751 |
| Marshall Islands | Majuro | 59,190 | 181 |
| Saint Kitts and Nevis | Basseterre | 53,192 | 270 |
| Monaco | Monaco | 39,242 | 2 |
| Liechtenstein | Vaduz | 38,128 | 160 |
| San Marino | San Marino | 33,931 | 61 |
| Palau | Ngerulmud | 18,169 | 459 |
| Nauru | Yaren (de facto) | 10,756 | 21 |
| Tuvalu | Funafuti | 11,792 | 26 |
| Vatican City | Vatican City | 825 | 0.44 |