Map Of Income Inequality Across Europe

We collated income inequality stats into a graph and a map of Europe. This highlights which countries have income inequality issues. Not all European countries have been included. Notables like Russia did not have the data available as of time of publishing.

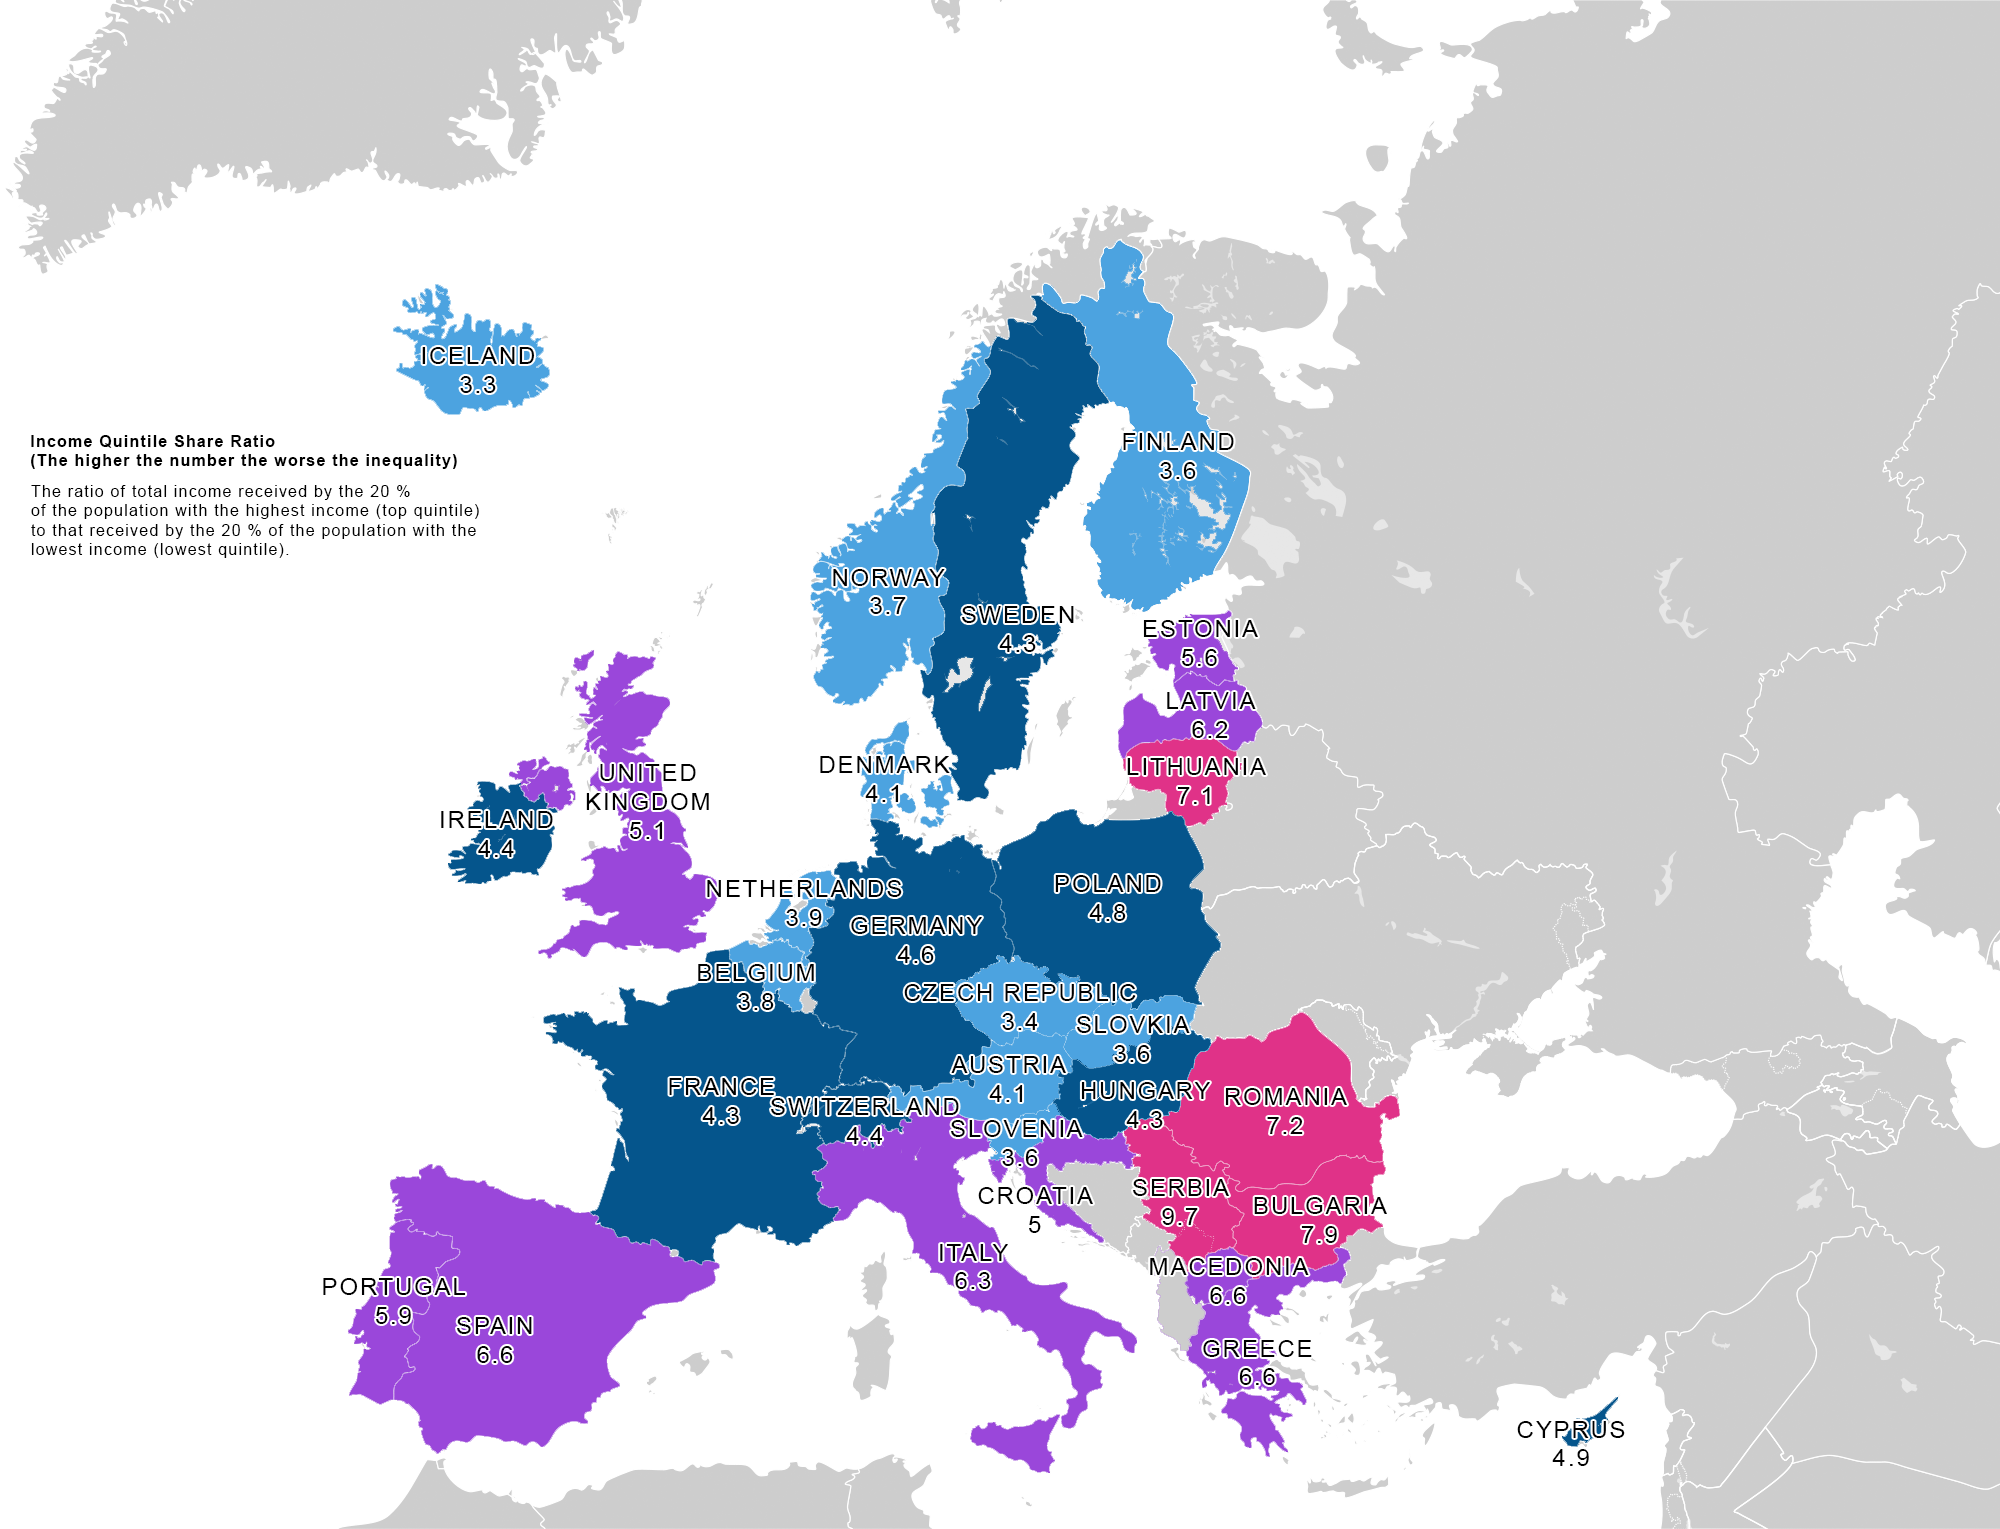
The formula that is used to derive the results in this article is “Income quintile share ratio”. This is the ratio of total income received by the 20 % of the population with the highest income (top quintile) to that received by the 20 % of the population with the lowest income (lowest quintile). Income must be understood as equivalised disposable income.
maybe swap the map and the graph i make the graph the featured image.

Bar Graph of Income Inequality Across Europe 2016-2017

Income inequality graph across Europe 2018

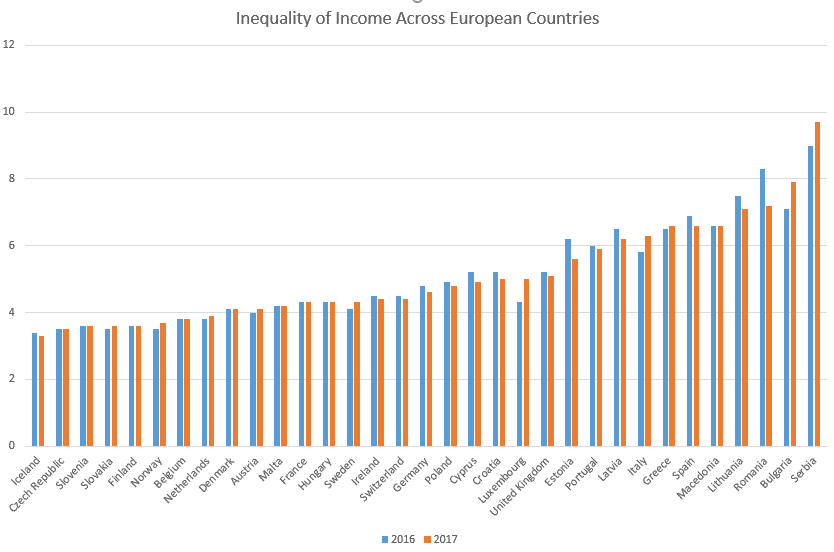
The above graph and map is based on the table below.

Table of Income Inequality Across European Countries.

Country 2016 2017
Iceland 3.4 3.3
Czech Republic 3.5 3.5
Slovenia 3.6 3.6
Slovakia 3.5 3.6
Finland 3.6 3.6
Norway 3.5 3.7
Belgium 3.8 3.8
Netherlands 3.8 3.9
Denmark 4.1 4.1
Austria 4 4.1
Malta 4.2 4.2
France 4.3 4.3
Hungary 4.3 4.3
Sweden 4.1 4.3
Ireland 4.5 4.4
Switzerland 4.5 4.4
Germany 4.8 4.6
Poland 4.9 4.8
Cyprus 5.2 4.9
Croatia 5.2 5
Luxembourg 4.3 5
United Kingdom 5.2 5.1
Estonia 6.2 5.6
Portugal 6 5.9
Latvia 6.5 6.2
Italy 5.8 6.3
Greece 6.5 6.6
Spain 6.9 6.6
Macedonia 6.6 6.6
Lithuania 7.5 7.1
Romania 8.3 7.2
Bulgaria 7.1 7.9
Serbia 9 9.7


Thanks to Eurostats for compiling these numbers.

Top 40 European Economies By GDP 2018

Top 40 European Economies 2018

Here we have a table of the top 40 European countries ranked by Gross Domestic Product. This doesn’t only include European Union Countries but all the countries that are considered part of the continent of Europe.

Some interesting takeaways from this years European GDP figures are the following:

  • Romania went up one place to become the 16th largest economy in the European Union (EU) in 2017. In the full list of countries that are considered part of Europe it is at 19th place.
  • Russia is still going backwards but that doesn’t seem to be affecting president Putin’s popularity. he won the election easily.
  • The Czech Republic is still growing strong, it also surpassed Greece in 2017 but this was largely expected unlike Romania.
  • Balkan countries like Croatia that have been hit rather hard in the last few years seem to be on their way to recovery.
2018 Rank Country 2011 2012 2013 2014 2015 2016 2017 2018
1st  Germany 3,761.142 3,545.946 3,753.687 3,885.440 3,365.293 3,494.898 3,684.816 4,211.635
2nd  United Kingdom 2,611.108 2,655.458 2,721.489 2,945.394 2,858.482 2,649.893 2,624.529 2,936.286
3rd  France 2,865.304 2,682.900 2,809.390 2,843.673 2,420.163 2,488.284 2,583.560 2,925.096
4th  Italy 2,278.376 2,073.972 2,130.997 2,141.937 1,815.759 1,858.913 1,937.894 2,181.970
5th  Russia 2,031.768 2,170.145 2,230.624 2,030.973 1,326.016 1,267.754 1,527.469 1,719.900
6th  Spain 1,489.381 1,340.689 1,369.690 1,383.537 1,199.715 1,252.163 1,313.951 1,506.439
7th  Netherlands 894.576 829.406 866.951 881.033 750.696 769.930 825.745 945.327
8th   Switzerland 696.528 665.898 685.871 712.050 664.603 651.770 678.575 741.688
9th  Poland 524.104 496.687 526.031 546.644 474.893 473.501 524.886 614.190
10th  Sweden 563.110 543.881 579.526 570.137 492.618 512.748 538.575 600.771
11th  Belgium 528.721 499.129 524.970 534.672 454.687 465.248 494.733 562.229
12th  Austria 429.493 407.801 428.456 437.123 374.124 387.299 416.845 477.672
13th  Norway 498.157 509.705 522.349 500.244 389.482 366.873 396.457 443.252
14th  Ireland 237.990 222.089 232.150 246.438 238.031 254.596 333.994 385.142
15th  Denmark 341.498 322.277 335.878 340.806 294.951 301.784 324.484 369.760
16th  Finland 273.925 256.849 268.281 271.165 229.671 234.578 253.244 289.557
17th  Czech Republic 227.307 206.751 208.796 205.658 181.858 185.269 213.189 251.577
18th  Portugal 245.120 216.488 224.983 230.012 199.077 205.085 218.064 248.891
19th  Romania 186.113 172.041 191.598 199.950 177.315 181.944 211.315 245.590
20th  Greece 289.068 249.663 242.306 238.023 195.320 194.594 200.690 226.774
21st  Hungary 139.447 126.825 133.424 137.104 120.636 117.729 132.034 163.541
22nd  Ukraine 163.307 175.707 179.572 130.660 90.524 83.550 109.321 119.134
23rd  Slovakia 97.621 92.799 97.743 99.971 86.629 89.797 95.938 111.483
24th  Luxembourg 59.010 56.323 60.150 62.395 57.423 60.176 62.393 72.461
25th  Bulgaria 55.799 52.613 54.517 55.837 48.957 49.364 56.943 64.781
26th  Croatia 62.172 56.484 57.849 57.159 48.850 49.928 54.516 61.056
27th  Belarus 59.735 63.615 71.710 76.139 54.609 45.887 54.436 59.246
28th  Slovenia 51.299 46.288 48.005 49.506 42.768 43.791 48.868 56.933
29th  Lithuania 43.478 42.828 46.426 48.232 41.267 43.024 47.263 54.352
30th  Serbia 46.488 40.749 45.520 43.866 36.513 37.381 41.471 48.279
31st  Latvia 28.488 28.343 30.838 31.970 27.048 28.177 30.319 35.915
32nd  Estonia 22.824 22.673 24.888 25.953 22.704 23.476 25.973 30.821
33rd  Iceland 14.666 14.183 15.330 16.693 16.718 18.633 23.909 29.109
34th  Bosnia and Herzegovina 18.318 16.906 17.852 17.977 15.794 16.324 18.058 20.340
35th  Albania 12.891 12.345 12.916 13.262 11.543 12.269 13.181 15.289
36th  Malta 9.604 9.289 10.056 10.582 9.801 10.341 12.543 14.873
37th  Macedonia 10.659 9.751 10.774 11.342 9.922 10.424 11.366 13.085
38th  Moldova 7.018 7.283 7.985 7.944 6.414 6.084 8.085 9.202
39th  Montenegro 4.500 4.048 4.419 4.462 4.039 4.182 4.764 5.547
40th  San Marino 2.056 1.802 1.802 1.786 1.566 1.569 1.636 1.809